This web page was produced as an assignment for Genetics 564, an undergraduate capstone course at UW-Madison.
What is Transcriptomics?
|
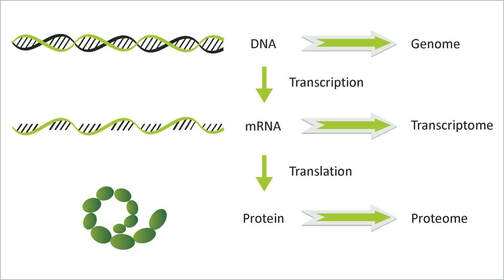
Transcriptomics is the study of the transcripts within a cell, tissue, or organ. Transcripts are made of RNA and are created from a DNA template. The transcripts of messenger RNAs (mRNAs) serve as templates from which proteins are created. Other RNAs also exist in the cell and primarily perform catalytic and regulatory functions. [1]
The transcriptome is extensively affected by external variables which makes it an excellent way to evaluate the effects of a disease on molecular function and protein expression. [1] |
|
How Can the Transcriptome be Evaluated?
1. Microarray
Microarray is one assay that can be performed to quantify the amount of RNA present in a given population. This is generally performed because the amount of RNA present is directly correlated to the amount of gene expression. To perform the technique, a glass slide with multiple wells is prepared. Each well has a DNA sequence that should complement the RNA being tested. The RNA bring evaluated is then converted back into DNA (called cDNA) and allowed to bind to the plate.
Generally, this assay is performed to compare a population affected by disease and a population that is healthy. The RNA from these separate populations is labelled with different fluorescent probes. The colors from the probes are then used to compile the results. [2]
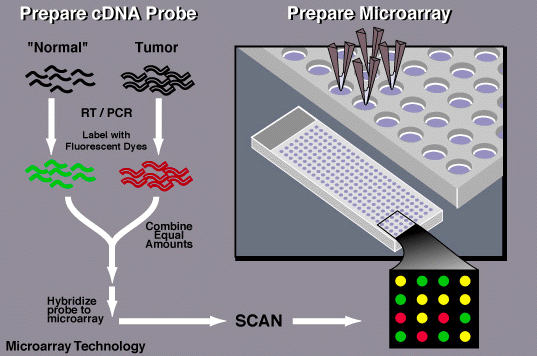
Figure 1. Preparation for a microarray
The results of the microarray are then presented in the form of a cluster analysis. This compiles all of the diseased and healthy samples tested and uses colors to convey if there was increased or decreased expression for each one. Pink indicates high relative expression and green indicates low relative expression. [3]
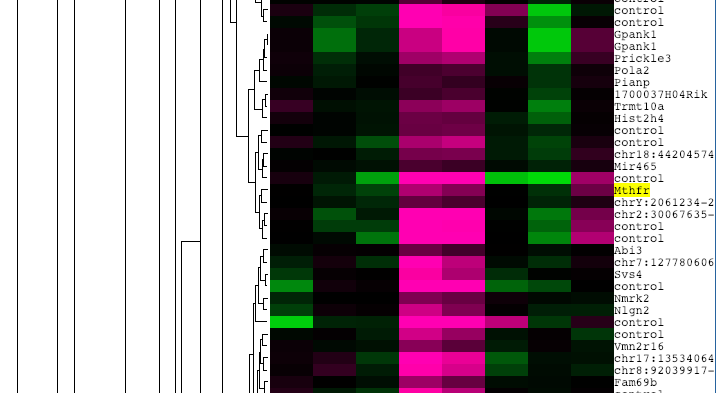
Figure 2. This is a cluster analysis for a study investigating the effect of lowered folate levels on genes in the folate metabolic pathway. From left to right is low to high disease.
|
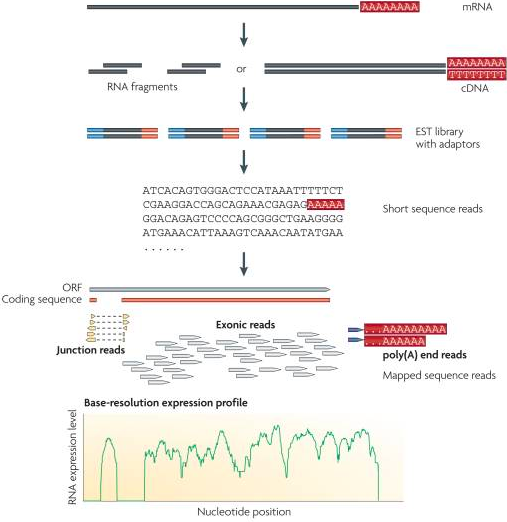
2. RNA Sequencing (RNA-Seq)
RNA Sequencing provides a way to sequence all of the transcripts in a cell. This is an extremely powerful tool to quantify and categorize all wholistic gene expression for a given cell. mRNA is first chopped into smaller segments and reverted back into DNA (cDNA). Next, the small fragments are marked on both ends with biological markers called adaptors which aid in putting the sequence back together. The short cDNA segments are then sequences and put back together using the adaptors and sometimes a reference genome or transcript. This sequence information can then be used to quantify gene expression. |
|
MTHFR Transcriptomics
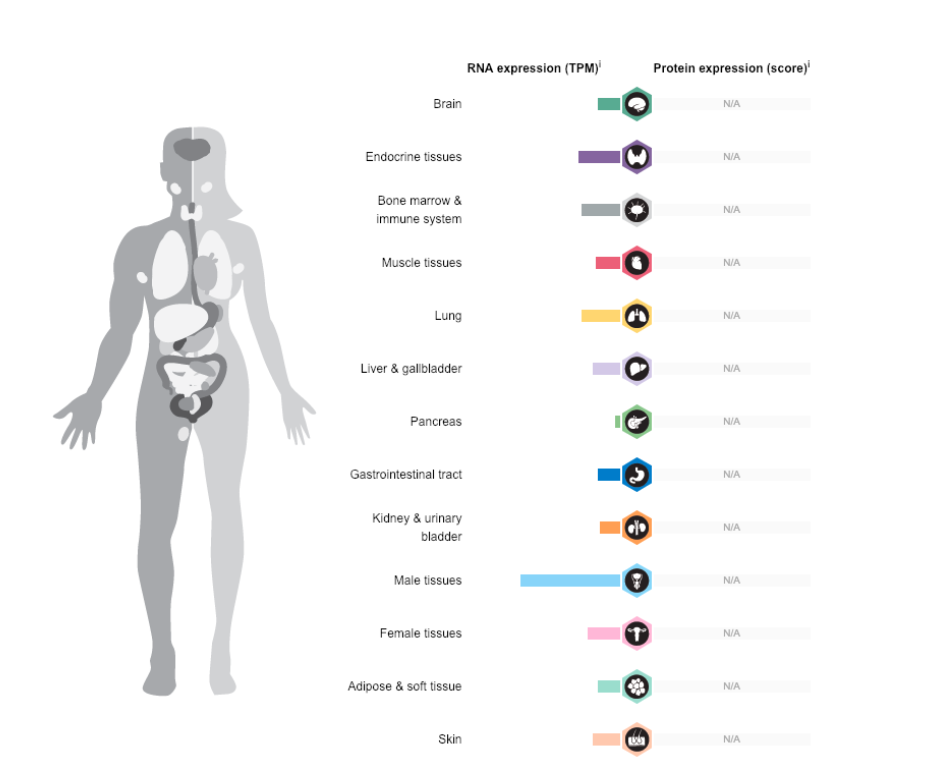
Information about RNA expression in the human body was gathered from the Human Protein Atlas. This resource is a database that compiles information about genetic and protein expression and functioning in cells, tissues and diseases. The expression results in MTHFR mapped to the relevant location in the body is pictured below.
Discussion
Transcriptomic analysis of MTHFR yielded surprising results. The cluster analysis pictured in figure 2 indicated that although expression changes in MTHFR in response to folate deficiency are small, there is a mix of over- and under-expression of MTHFR in the disease state under these conditions. Scientists have demonstrated that low folate and MTHFR mutation are both correlated to spina bifida.[5] However, this suggests that MTHFR may be changing in direct response to folate levels in some sort of feedback pathway.
Moreover, the expression pattern in specific tissues was also unusual. Male tissues had by far the highest expression. This makes me wonder if paternal genotype or sex of the child may either serve as a protective or pathogenic contribution to spina bifida development.
Moreover, the expression pattern in specific tissues was also unusual. Male tissues had by far the highest expression. This makes me wonder if paternal genotype or sex of the child may either serve as a protective or pathogenic contribution to spina bifida development.
References:
[1] Assis, A.F., Oliviera, E.H., Donate, P.B., Giuliatti, S., Nguyen, C. & Passos, G.A. (2015). What is the transcriptome and how is it evaluated? Transcriptomics in Health and Disease, 3-48.
[2] NIH. (2015, August 27). DNA Microarray Technology. https://www.genome.gov/10000533/dna-microarray-technology/
[3] https://www.ncbi.nlm.nih.gov/gds/
[4] Wang, Z., Gerstein, M., Snyder, M. (2010). RNA-Seq: A revolutionary tool for transcriptomics. Nature Reviews Genetics, 10, 57-63.
[5] Au, K.S., Ashley-Koch, A. & Northrup, H. (2011). Epidemiologic and genetic aspects of spina bifida and other neural tube defects. Developmental Disabilities Research Reviews, 16, 6-15.
Images:
Header: https://www.chemistryworld.com/news/breaking-the-silence-of-rna-interference-drugs/3009784.article
Image 1: http://fischergen564s17.weebly.com/transcriptomics.html
Figure 1: https://www.genome.gov/10000533/dna-microarray-technology/
Figure 2: https://www.ncbi.nlm.nih.gov/geo/gds/analyze/analyze.cgi?ID=GDS5377
Image 2: https://www.ncbi.nlm.nih.gov/pmc/articles/PMC2949280/
Image 3: https://www.proteinatlas.org/
